
Overview - Measure the progress towards your goalsWhy we need to learn faster what worksHow to make the most of this PlaybookOverview with an exampleStep 1 - What we Measure - Define your customer journey steps in measurable metrics1.1 ToFu - Metrics for Awareness1.2 MoFu - Metrics for Consideration1.3 BoFu - Metrics for Conversion1.4 GroFu - Metrics for GrowthAction Steps - What we MeasureFurther ResourcesStep 2 - How we Measure - Ensure that you can track each important metric2.1 Spreadsheets - Best for the beginning and difficult metrics2.2 Tracking Tools - Setup for web tracking and advertising2.3 CRM Events - Tracking important events of our contactsAction Steps - How we MeasureFurther ResourcesStep 3 - How we Report - Keep track of these metrics in actionable reports3.1 Input, Process and OutputAction Steps - How we ReportFurther ResourcesStep 4 - What to Improve - Identify bottlenecks and derive data-informed actions4.1 Bottlenecks & North Star Metric - Where are our users stuck in the customer journey?Action Steps - What to ImproveFurther ResourcesSummary - Eyes on the North StarFrom unreliable metrics tools to measurable growth
Overview - Measure the progress towards your goals
Playbook Template
Pirate Skills Example
Why we need to learn faster what works
Eyes on the North Star
Welcome to the pivotal opening chapter of our Data Analytics course in the Growth Marketing Mastery series. Here, we delve into the essence of why accelerated learning is fundamental to our marketing strategies. This chapter is not just an introduction; it's a gateway to understanding the vital role analytics plays in our journey towards growth.
The Critical Role of Data Analytics
In the realm of growth marketing, data analytics is the beacon that guides us. It's the tool that empowers us to learn swiftly what works and what doesn't in our marketing endeavors. As we set sail on this journey, imagine a scenario where you're competing against your fiercest rival for the same audience. The edge lies in who learns and adapts faster, and data analytics is the key to gaining this advantage.
Setting Our Sights with Analytics
Our journey begins with understanding the broader context of growth marketing. We start with our growth roadmap, setting specific goals and identifying bottlenecks in our customer journey. Data analytics provides the insights necessary to pinpoint where we're falling short and what areas need our attention to improve the customer experience and profitability.
The Power of Analytics in Strategy
Data analytics is more than just numbers; it's a narrative tool that puts numbers to each step of the customer journey. From gaining visibility to understanding conversion rates, analytics helps us identify areas like lead shortages or funnel inefficiencies. It is the bedrock upon which we build our strategies, guiding our decisions on content creation, traffic generation, and conversion optimization.
Content Creation Informed by Analytics
When it comes to content, analytics plays a critical role. It informs us which content resonates with our audience, which landing pages are most effective, and which email funnels build the most trust. This information is crucial for creating valuable content that engages and converts.
Optimizing for Efficiency and Effectiveness
In marketing, there's a saying that half of our budget is wasted; we just don't know which half. Analytics aims to answer this by highlighting what efforts are worth our time and money. This optimization is crucial before we step into larger-scale marketing efforts like paid advertising and SEO.
The Creative and Analytical Synergy
For those on the creative side, analytics offers real, measurable feedback on your designs, texts, and videos. It's about evolving your instincts with data-backed insights. And for those already inclined towards performance, leveraging analytics enhances your understanding of content and creative strategy.
How to make the most of this Playbook
This part is designed to guide you on how to extract the maximum value from this course. We'll cover the practical steps and strategies to ensure that your learning experience is not only educational but also transformative.
Engage with the Course Material Actively
The first step in maximizing the course is to engage actively with the provided materials. This involves getting your own version of the Miro board used in the course. The board is a dynamic tool that allows you to zoom into each area, offering a hands-on experience. The template on the left is for your work, while the right-hand side presents a practical example from Pirate Skills. The key is to replace the template with your own KPIs, tracking setup, and reports, making the course content directly applicable to your situation.
Personalize and Apply the Concepts
As you progress through the course, constantly think about how the concepts apply to your unique context. If a topic seems too basic or advanced, roll with it and adapt it to your needs. For instance, if social media and SEO aren't your primary channels, and you focus more on partnerships, modify the canvas accordingly. This personalization is crucial in making the course relevant and practical for you.
Engage with the Community
Utilize the Sailors Circle community, a platform where you can discuss specific problems and share your experiences. This community is not just for sharing what works, but more importantly, for addressing what doesn't. The collaborative environment allows you to gain insights from others' experiences and solutions, enhancing the value you derive from the course.
Seek Assistance and Collaborate
Never hesitate to reach out if you have questions or need clarification. You can contact me directly via email or through the Sailors Circle. Remember, you're not alone in this journey. We're here to support each other, ensuring that everyone can make the most of their learning experience.
- Don’t just read, follow along.
- Make a copy of the Miro Playbook and start using it.
- Scan the summary at the beginning of each chapter.
- Do the action steps provided at the end of each chapter.
- Follow along the Growth Marketing Mastery videos, if you have access to them.
- Discuss the topics with your team and the other members in the Pirate Skills Community.
- Make the Playbook YOURS. Change it as you please. You AARRR a pirate!
Overview with an example
Introduction to a Practical Data Analytics Framework
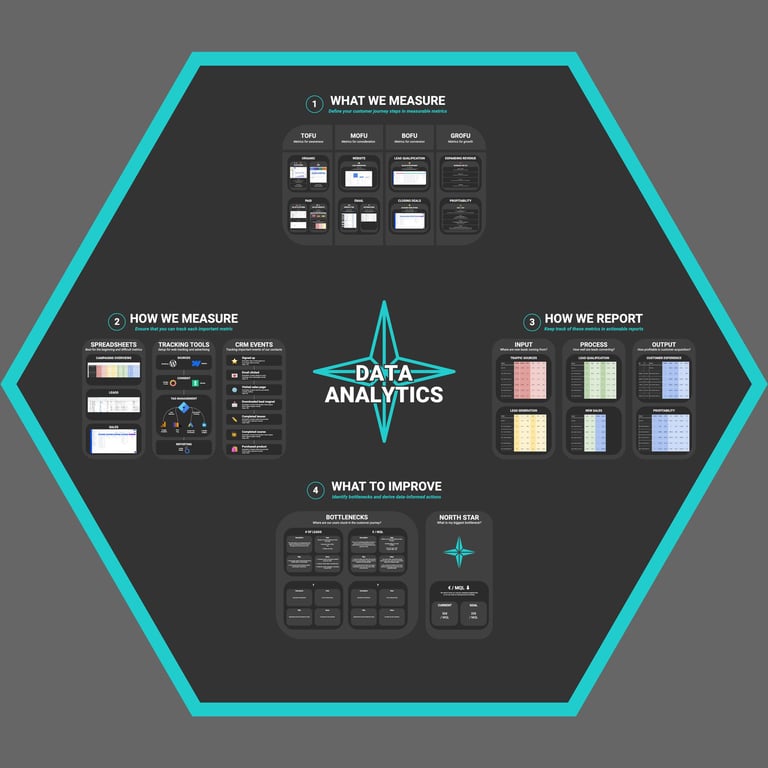
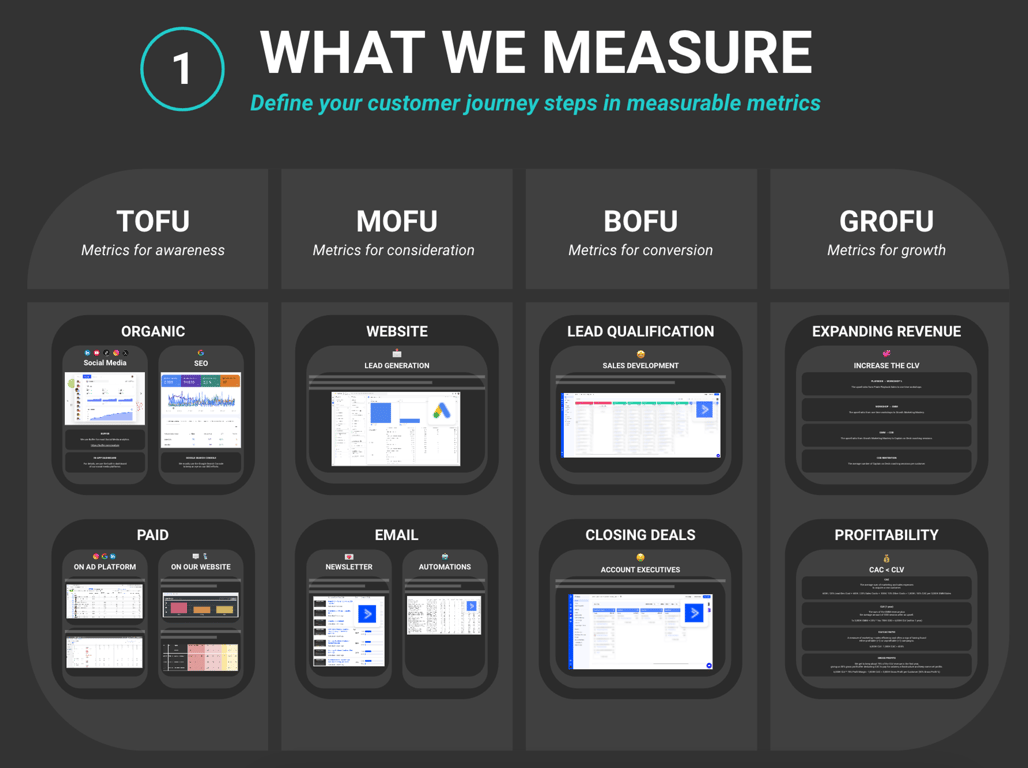
Using Pirate Skills as an example, we can see these steps in action. From measuring organic and paid traffic channels to analyzing customer engagement and sales conversions, each aspect of the customer journey is scrutinized and optimized. This case study serves as a blueprint for applying data analytics effectively. Our focus is not on prescribing advice, but rather showcasing a practical application of the principles we've been discussing.
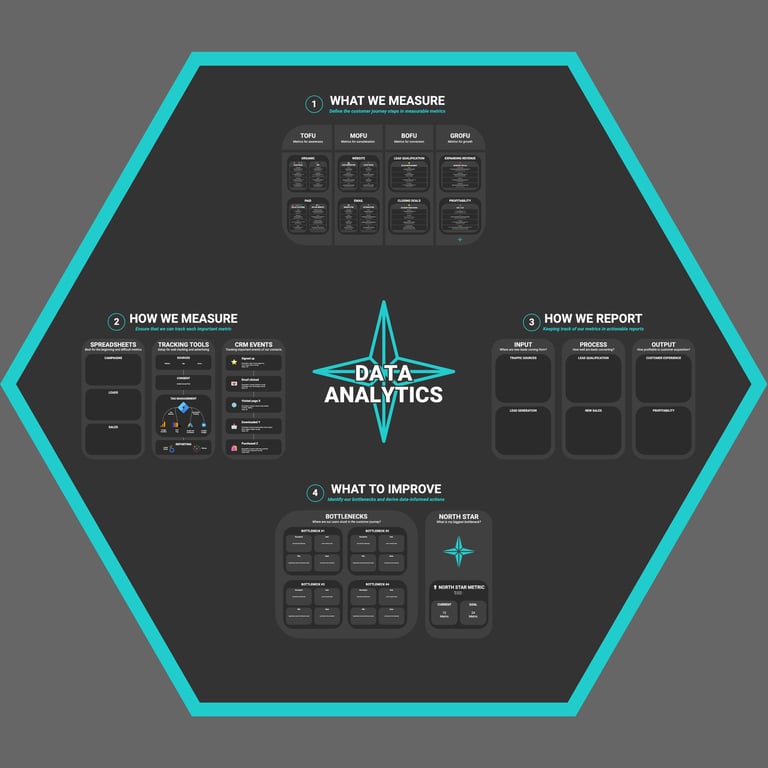
The Four Steps of Data Analytics in Action
Data analytics, when broken down into its core components, involves four key steps: defining what to measure, setting up tracking, reporting, and identifying areas for improvement. These steps form the backbone of our analytical process, guiding us through a structured approach to understanding and optimizing our marketing strategies.
1. Defining What to Measure
The journey begins by defining the crucial metrics along the customer journey. At Pirate Skills, this involves breaking down the customer journey into stages like awareness (ToFu), consideration (MoFu), decision-making (BoFu), and customer growth. Each stage has its primary channels and associated metrics, such as social media and SEO for organic traffic and advertising for paid traffic. The goal is to pinpoint the key performance indicators (KPIs) that truly matter.
2. Setting Up the Tracking System
After defining our KPIs, the next step is establishing a robust tracking system. At Pirate Skills, this encompasses spreadsheets for overarching campaign overviews, tracking tools for detailed analytics, and CRM systems for customer journey insights. The emphasis is on deriving reliable data sources that accurately reflect our marketing performance.
3. Effective Reporting
Once the tracking is in place, we move to the reporting phase. This involves visually representing our data to make it actionable and understandable. The reporting structure at Pirate Skills is divided into three main areas: traffic sources, lead generation and qualification, and customer experience and profitability. This holistic view ensures that we maintain a complete understanding of the entire customer flow.
4. Identifying Areas for Improvement
The final step is using our reports to identify areas for improvement. This could involve enhancing our lead generation strategies, reducing customer acquisition costs, or improving our sales processes. The focus is always on increasing impact and profitability, tailoring our efforts to address the most pressing bottlenecks.
Pirate Skills Example

Step 1 - What we Measure - Define your customer journey steps in measurable metrics
Playbook Template
Pirate Skills Example
GOAL
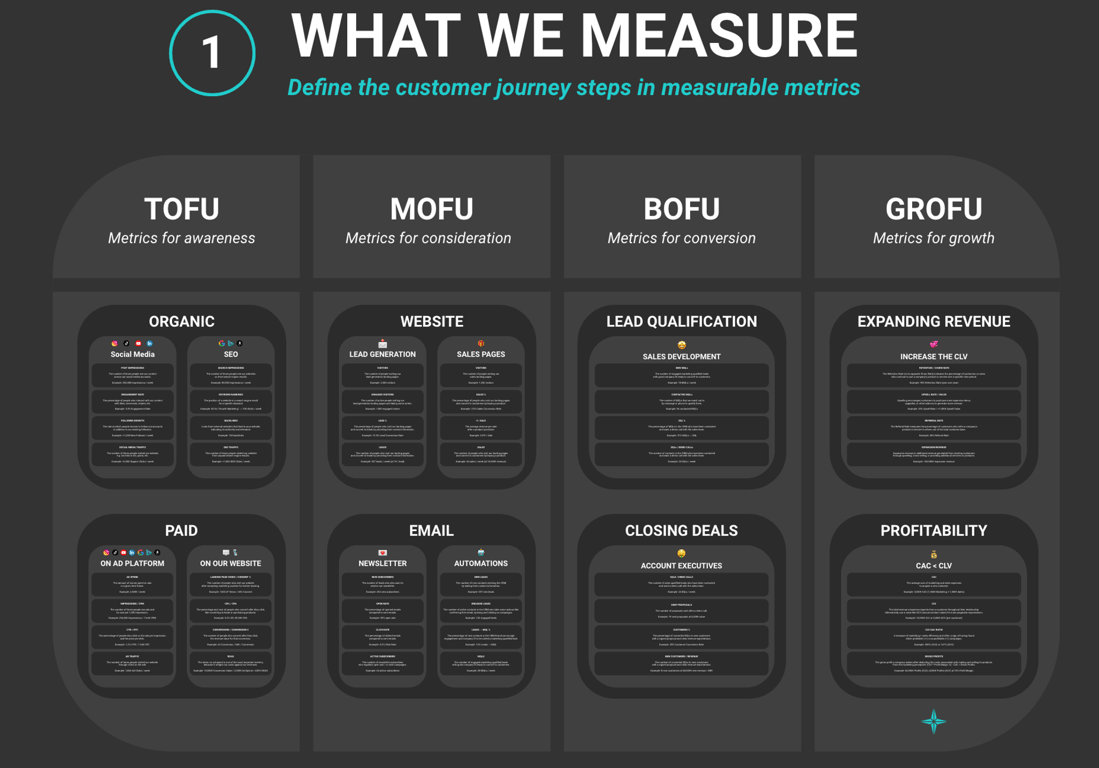
Before we talk about tracking tools and reports, we need to define what we want to measure along the customer journey. For each important step, we define the metrics we want to track and what “good” would look like.
Before we talk about tracking tools and reports, we need to define what we want to measure along the customer journey. For each important step, we define the metrics we want to track and what “good” would look like.
CONCEPTS & DEFINITIONS
Top of the Funnel (ToFu)
The top of the funnel represents the first stage of the customer's journey, where individuals become aware of a brand or product. It focuses on generating interest and attracting a broad audience. Key metrics here include impressions and engagement on social media, aiming to measure how effectively a brand captures attention and begins interaction with potential consumers.
Middle of the Funnel (MoFu)The middle of the funnel, or MoFu, is the stage where potential customers evaluate a business's products or services and consider making a purchase. It's a critical phase of lead nurturing, involving educational content and personalized marketing to build trust and preference. Tracking metrics such as engagement on lead generation pages and email campaign performance is crucial in moving leads toward a purchasing decision.
Bottom of the Funnel (BoFu)
The bottom of the funnel, or BoFu, is where leads are converted into customers. This stage encompasses the final evaluation, decision-making, and purchasing actions. Metrics that matter here include the SQL conversion rate and the close rate, which reflect how effectively the business converts qualified leads into actual sales, measuring the performance of the sales strategies.
Growth Phase (GroFu)
GroFu is a critical post-conversion stage where the focus shifts to maximizing the value of existing customers. It centers on expanding revenue through upselling, cross-selling, and increasing customer referrals. In the GroFu stage, companies strive to enhance overall profitability and impact by boosting Customer Lifetime Value (CLV) and ensuring that existing clients become active brand advocates. Key metrics in this phase include expansion revenue, referral rate, and the CLV/CAC ratio, which collectively measure the effectiveness of growth strategies and the sustainable scaling of the business.
Customer Acquisition Costs (CAC)
Customer Acquisition Costs are the total expenses incurred to acquire a new customer. This includes all marketing and advertising costs divided by the number of customers gained within a specific period. Tracking CAC helps determine the investment's efficiency and guides budget allocation to the most effective channels.
Customer Lifetime Value (CLV)
Customer Lifetime Value is the total revenue a business expects from a single customer throughout their entire relationship. The aim is to estimate the economic value a customer brings, guiding strategic decisions regarding customer retention and the allocation of resources to maximize profitability.
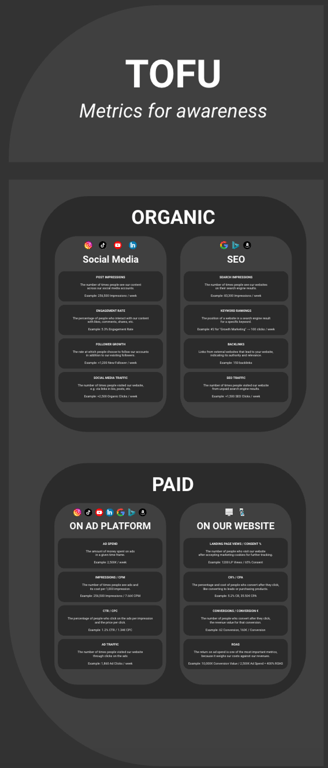
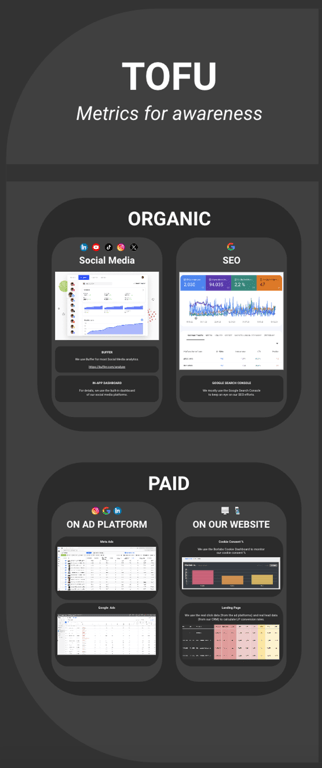
1.1 ToFu - Metrics for Awareness
Let’s focus on defining customer journey steps with measurable metrics, particularly in the awareness stage (ToFu). The key organic metrics include post impressions, engagement rate, follower growth, and social media traffic, which assess audience interaction and reach on platforms like LinkedIn, Instagram, and TikTok. For paid advertising, important metrics are spending, impressions, click-through rate, cost per click, and conversions, indicating the effectiveness of paid campaigns in driving traffic and engagement. These metrics help identify bottlenecks, guiding improvements to increase impact and profitability, and are essential for informed decision-making in performance marketing.
Playbook Template
Pirate Skills Example
As we delve into the realm of Data Analytics, it’s essential to focus on metrics for awareness, especially at the Top of the Funnel (ToFu) stage. In this chapter, we'll explore how to define these metrics and use Pirate Skills as an example to bring clarity to our understanding.
Defining Organic Metrics
Organic metrics are vital in social media marketing, regardless of the platform. We start with Post Impressions, which represent the number of times people see our content. This helps us gauge our reach. For instance, 250,000 impressions per week can indicate significant visibility.
The next step is measuring Engagement. This refers to the percentage of people who interact with our posts through likes, comments, or shares. An engagement rate of 5.3%, for example, demonstrates how our content resonates with our audience.
Follower Growth is another crucial metric, albeit its importance has shifted over time due to changes in social media algorithms. However, a steady increase in followers can still signify growing interest in our brand.
Lastly, we focus on Social Media Traffic, which measures the number of people clicking on links in our posts or bios, leading them to our website or other destinations. This metric bridges the gap between awareness and the next steps in the customer journey.
Paid Advertising Metrics
In the context of paid advertising, we track:
- Spending: Knowing our expenditure, like €2,500 per week, is fundamental.
- Impressions: We measure how many people see our paid content.
- Click-Through Rate (CTR) and Cost Per Click (CPC): These metrics assess the effectiveness of our ads in driving traffic to our website.
- Traffic Conversions: It's crucial to know the conversion rate on our landing pages, i.e., the percentage of visitors who perform desired actions.
- Value of Conversions: Assigning a monetary value to each conversion, whether it’s a lead, sale, or another key action.
Applying the Metrics
Using Pirate Skills as an example, we can see how these metrics play out in a real scenario. Suppose we spend €2,500 on ads, resulting in 250,000 impressions. If our CTR is 1.2% with a CPC of €1.34, we need to ensure this investment translates into meaningful traffic and conversions on our website. If our conversion rate is 5.2% with a cost of €35.50 per acquisition, we can calculate the return on investment and assess the profitability of our efforts.
Making It Practical
Now, let's make these metrics practical. Use your Miro board to note down the key metrics for your campaign. Focus on a few critical ones, like four for organic and perhaps eight for paid channels. Customize these metrics based on your tools and tracking setup, ensuring they align with your business objectives and audience behavior.
Remember, the goal is not to overwhelm yourself with data, but to select meaningful metrics that provide clear insights into your marketing performance. By focusing on these key areas, you’ll be able to monitor your progress and make informed decisions to optimize your strategies.
Action Steps
Define the areas in which you want to track your ToFu metrics
Choose the most relevant metrics for organic growth
Choose the most relevant metrics for paid growth
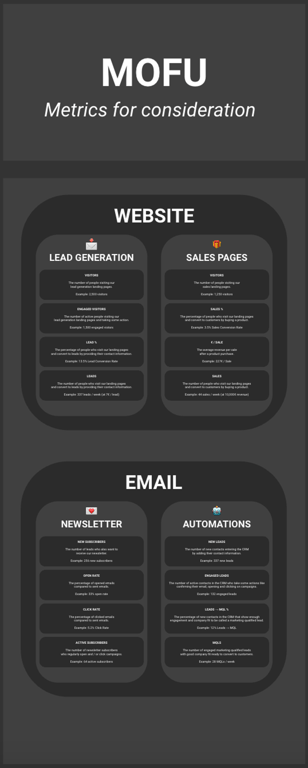
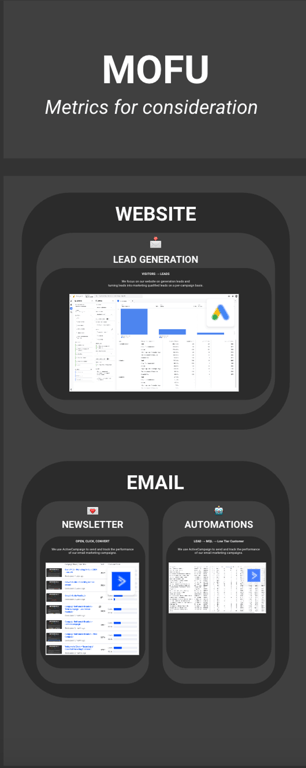
1.2 MoFu - Metrics for Consideration
Focusing on the middle of the funnel, the chapter emphasizes tracking visitor engagement and lead conversion on websites, particularly on lead generation pages. It highlights the importance of monitoring visitor interactions and active engagement, noting that not all visitors convert or accept cookie consents. The lead conversion rate is identified as a key metric. The chapter also covers email marketing, stressing the significance of tracking new subscribers, open and click rates, and identifying active subscribers. It underscores the role of automations in transforming leads into Marketing Qualified Leads (MQLs) and preparing strategies for converting these MQLs into actual sales in the next phase.
Playbook Template
Pirate Skills Example
In this crucial phase of the customer journey, our focus shifts to what happens after potential customers click on our ads, posts, or search results. Typically, they land on our website, the primary arena where our next set of crucial metrics come into play.
Lead Generation and Website Engagement
When visitors arrive at our lead generation pages, we meticulously track their numbers. It's not just about how many visits, but how many engage actively, clicking and interacting with our content. This active engagement is pivotal, yet we face the stark reality that not all visitors will convert. Many may not even accept cookie consents, limiting our tracking capabilities. The key metric here is the lead conversion rate - the percentage of visitors who take the plunge and become leads, such as signing up for a webinar or subscribing to a newsletter.
Sales Conversion Rates on Websites
For sales-focused landing pages, the principles are similar. The critical difference lies in the conversion rate, now measured by sales. Here, too, a majority may browse without buying, highlighting the ongoing challenge of converting interest into tangible sales.
Email Newsletters and Automations
With newsletters, the new subscribers' count is essential, along with the open and click rates, which measure engagement. A crucial aspect here is the concept of active subscribers - those who regularly interact with our content. This distinction helps us understand the true reach and impact of our email campaigns.
Turning Leads into MQLs
Automations play a pivotal role in transforming leads into Marketing Qualified Leads (MQLs). These are prospects who show a heightened interest and fit well with our offerings. They might interact with our content, download multiple lead magnets, or even book a demo call. The goal of our automations is to nurture these leads effectively, guiding them smoothly to this more qualified stage.
As we wrap up this stage, our focus is on two key outcomes: generating a healthy number of leads and converting a substantial portion of them into MQLs. This process sets the stage for the next crucial phase – turning these MQLs into actual sales, which we will explore in the upcoming chapter of our journey.
Action Steps
Define the areas in which you want to track your MoFu metrics
Choose the most relevant metrics for lead generation
Choose the most relevant metrics for direct sales pages
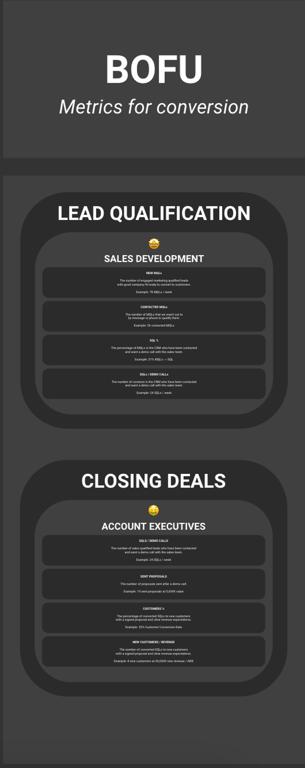
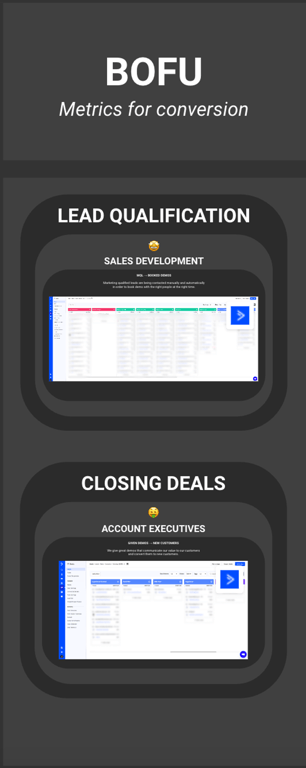
1.3 BoFu - Metrics for Conversion
In the Bottom of the Funnel (BoFu) stage, the focus shifts to qualifying Marketing Qualified Leads (MQLs) and converting them into Sales Qualified Leads (SQLs). Sales teams selectively engage with MQLs, assessing their fit and readiness. The SQL conversion rate is crucial, reflecting the effectiveness of this vetting process. Subsequently, account executives conduct demo calls with SQLs, leading to customer proposals. The demo-to-customer conversion rate is closely monitored to measure sales efficacy. The final stage involves customer acquisition and revenue generation, assessing the value of each new contract to understand the overall impact of the conversion process on revenue and growth.
Playbook Template
Pirate Skills Example
Playbook Template
Pirate Bills Example
Lead Qualification and Conversion
In the Bottom of the Funnel (BoFu) phase, our primary focus is on qualifying leads and guiding them towards conversion. Initially, Marketing Qualified Leads (MQLs) enter the sales funnel, filtered through our CRM. However, not all MQLs are contacted; sales teams selectively engage based on the potential customer's fit and readiness.
SQL Conversion Rate
Following initial qualification, the Sales Qualified Lead (SQL) conversion rate becomes pivotal. This metric reveals how many MQLs successfully transition to SQLs after thorough vetting by sales teams. This step is crucial in determining the quality and relevance of leads before proceeding further in the sales process.
Demo Calls and Proposals
Account executives then take the helm, engaging with SQLs through demo calls. These interactions are critical in understanding the customer's needs and readiness for a proposal. The demo-to-customer conversion rate, tracked meticulously, reflects the effectiveness of these demos in leading to actual sales.
Revenue Generation and Customer Acquisition
Finally, the process culminates with customer acquisition and revenue generation. The value of each new customer contract is assessed, contributing to overall revenue. This stage is not merely an endpoint but a gateway to further growth opportunities and a measure of the success of the entire conversion strategy.
Playbook Template
Pirate Bills Example
Action Steps
Define the areas in which you want to track your BoFU metrics
Choose the most relevant metrics for lead qualification
Choose the most relevant metrics for sales conversion
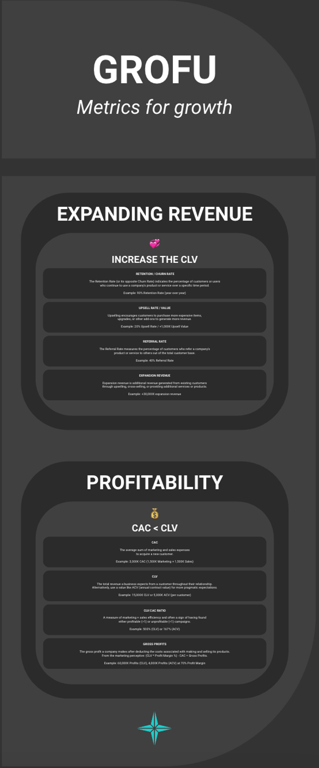
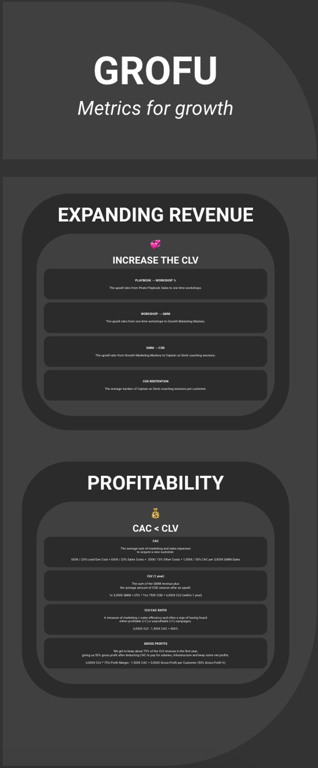
1.4 GroFu - Metrics for Growth
Let’s explore the critical metrics behind growth metrics, focusing on enhancing customer lifetime value (CLV) and optimizing customer acquisition costs (CAC). Understanding retention rates, increasing upsell and cross-sell opportunities, and boosting referral rates are crucial strategies that contribute to our overall growth. We highlighted the importance of keeping a keen eye on expansion revenue and the dynamics between profitability metrics like CAC and LTV. Ultimately, establishing gross profits and successfully managing them is the ultimate measure, shaping our business's strength and competitiveness in the market.
Playbook Template
Pirate Skills Example
Playbook Template
Pirate Bills Example
Playbook Template
Pirate Bills Example
Introduction to GroFu Metrics
When diving into growth marketing, we must understand the pivotal metrics that measure progress. Following customer acquisition, it’s essential that we don't just let customers be; we must onboard them effectively, ensuring that they're not just content, but happy and well-versed in all our offerings. This proactive approach enhances their experience, often leading to increased Customer Lifetime Value (CLV), a critical metric in growth marketing.
Retention and Churn Rate
Retention rate, along with its counterpart, churn rate, greatly impacts CLV. Our goal is to keep monthly subscribers engaged beyond just the initial sign-up. Boosting retention contributes to higher revenue and ensures that customers derive greater value from our product. Monitoring signals for retention and churn gives us an opportunity to make timely improvements, which is invaluable for sustaining customer relationships.
Upsell and Cross-Sell Opportunities
The inclusion of complementary products or upgrade options expands our revenue stream further, contributing significantly to CLV. A simple upsell can effectively double a customer’s monthly contribution, providing more funds that we can put back into growth or use to gain a competitive edge. In competitive markets, the player with a larger budget for customer acquisition often leads.
Referral Rate
Another metric we watch closely is the referral rate. Encouraging existing customers to refer new ones can significantly reduce customer acquisition costs and accelerate growth. Although a referral rate of 10-20% may seem modest, it yields substantial benefits by lowering acquisition expenses and enhancing our competitive stance.
Expansion Revenue
As growth marketers, our objective extends beyond the sales team's initial customer revenue. We aid in revenue expansion by engaging customers with the right messages and providing cues to customer success teams on identifying expansion opportunities or potential churn risks.
Profitability Metrics: CAC and LTV
Closely monitoring costs related to customer acquisition (CAC) against the CLV is the essence of growth marketing. We aim to minimize CAC and maximize LTV to ensure scalable and profitable growth. Our role includes differentiating profitable investments that deserve doubling down from unprofitable costs that require optimization or potential termination.
Establishing Gross Profits
Finally, the culmination of all our efforts is the gross profit. An effective measure for marketers is to calculate the profit margin, multiply it by the appropriate LTV metric (annual or full-term), and then subtract CAC. This formula puts us in a position of strength, knowing that our model is not just sustainable, but also profit-generating.
Action Steps
Define the areas in which you want to track your GroFu metrics
Choose a handful of metrics for revenue expansion
Choose a handful of metrics for profitability and impact
Action Steps - What we Measure
Step 1 - What we Measure - Define your customer journey steps in measurable metrics
ToFu - Metrics for awareness
Define the areas in which you want to track your ToFu metrics
Choose the most relevant metrics for organic growth
Choose the most relevant metrics for paid growth
MoFu - Metrics for consideration
Define the areas in which you want to track your MoFu metrics
Choose the most relevant metrics for lead generation
Choose the most relevant metrics for direct sales pages
BoFu - Metrics for conversion
Define the areas in which you want to track your BoFu metrics
Choose the most relevant metrics for lead qualification
Choose the most relevant metrics for sales conversion
GroFu - Metrics for growth
Define the areas in which you want to track your GroFu metrics
Choose a handful of metrics for revenue expansion
Choose a handful of metrics for profitability and impact
Further Resources
Dig deeper into metrics
- Books
- Online
- Pirate Skills
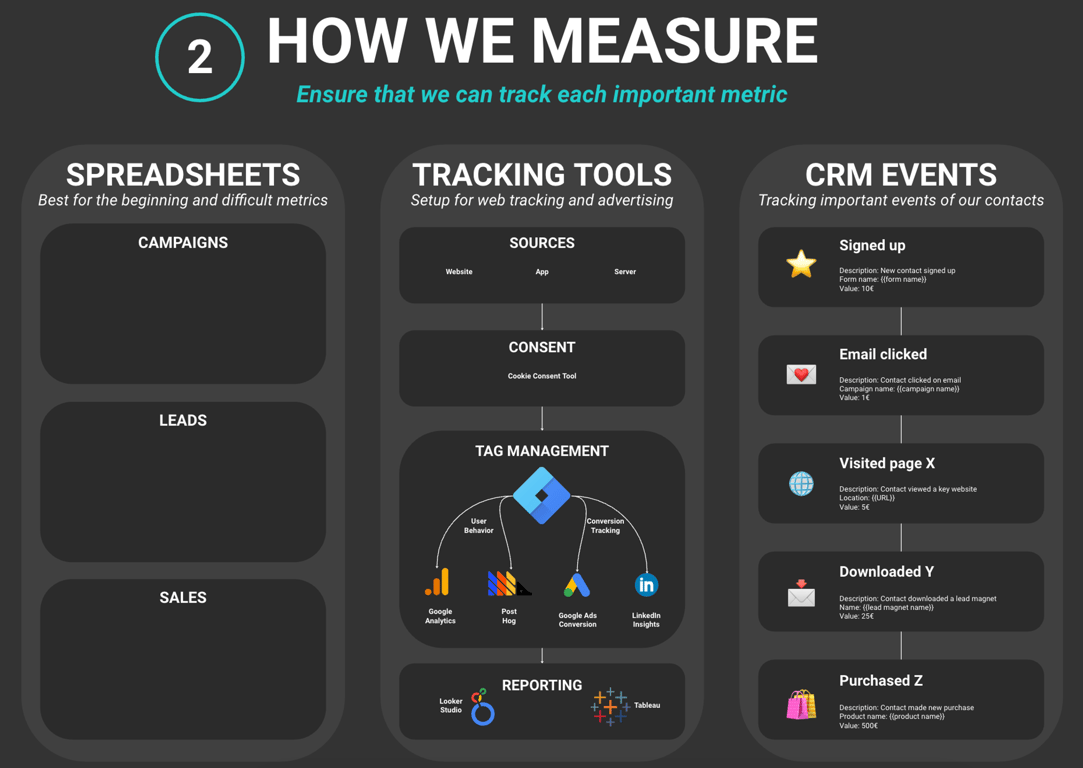
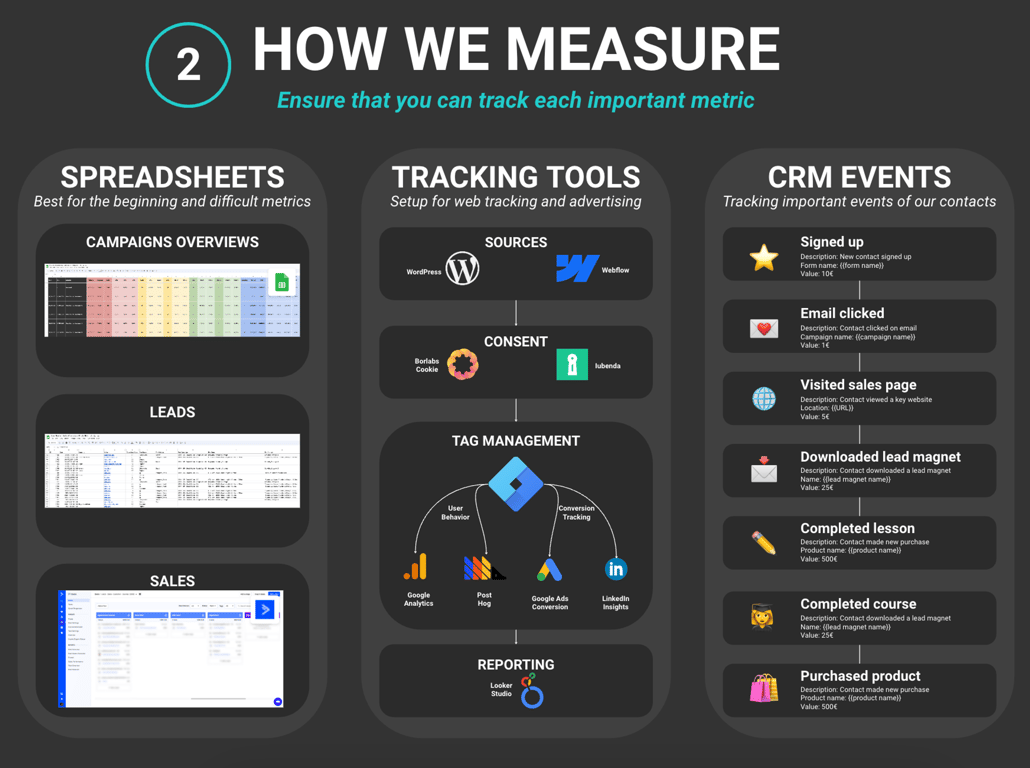
Step 2 - How we Measure - Ensure that you can track each important metric
Playbook Template
Pirate Skills Example
GOAL
Our goal is to learn about the fundamental value of spreadsheets, web tracking and CRM tools for measuring and analyzing vital metrics. They are not just tools for recording data, but are essential for understanding our ad spend, lead generation, and linking our campaigns directly to revenue. We aim to deepen our expertise in web tracking and advertising tools, emphasizing the significance of a solid framework over ever-changing details. This includes managing data from various sources and distinguishing between user behavior and conversion tracking. Utilizing platforms like Looker Studio, we'll turn data into actionable reports, extracting insights to refine our marketing strategies. Additionally, we're focusing on CRM events tracking to gain a deeper understanding of our customers' journey, transforming this knowledge into strategies that drive conversions and propel our business growth.
Our goal is to learn about the fundamental value of spreadsheets, web tracking and CRM tools for measuring and analyzing vital metrics. They are not just tools for recording data, but are essential for understanding our ad spend, lead generation, and linking our campaigns directly to revenue. We aim to deepen our expertise in web tracking and advertising tools, emphasizing the significance of a solid framework over ever-changing details. This includes managing data from various sources and distinguishing between user behavior and conversion tracking. Utilizing platforms like Looker Studio, we'll turn data into actionable reports, extracting insights to refine our marketing strategies. Additionally, we're focusing on CRM events tracking to gain a deeper understanding of our customers' journey, transforming this knowledge into strategies that drive conversions and propel our business growth.
CONCEPTS & DEFINITIONS
Web Tracking Tools
Software tools used to collect and analyze data on how users interact with a website or app. These tools provide insights into user behavior, preferences, and engagement with online content.
User Behavior Tracking
Monitoring and analyzing how users interact with a website or app. This includes tracking clicks, page views, and other actions to understand user engagement and experience.
Conversion Tracking
A method used in digital marketing to monitor and measure the effectiveness of marketing efforts by tracking actions like form submissions or purchases. It's essential for understanding how well advertising campaigns convert visitors into customers.
Advertising Pixels
Small pieces of code placed on websites to track user behavior and conversions from advertising campaigns. These pixels enable marketers to measure the effectiveness of their ads and tailor future marketing efforts.
Cookie Consent Tool
A solution that manages user consent for cookies on websites, ensuring compliance with privacy regulations like GDPR. It's vital for ethically tracking user data and respecting visitor privacy.
Tag Manager
A tool that allows marketers to manage and deploy marketing tags (snippets of code or tracking pixels) on a website or mobile app without modifying the code.
CRM Events
The process of monitoring and analyzing key actions or 'events' within a Customer Relationship Management (CRM) system. This tracking provides insights into customer interactions, preferences, and journey, aiding in personalized marketing efforts.
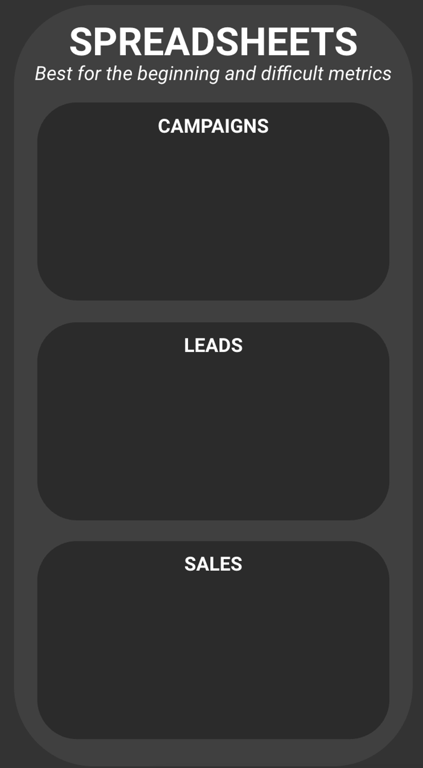
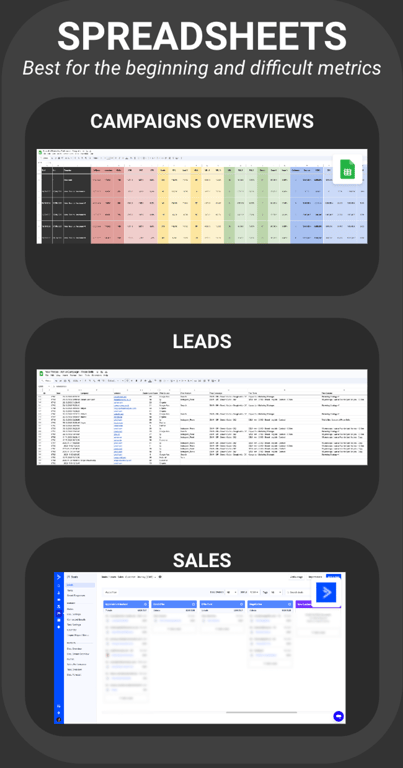
2.1 Spreadsheets - Best for the beginning and difficult metrics
Let’s establish the indispensable role spreadsheets play in growth marketing, particularly for startups and complex metric tracking. Despite any perceived tedium or simplicity, spreadsheets provide a foundational tool for tracking and analyzing key marketing data. A campaign overview captures the essence of ad spend and lead generation, but manual verification against CRM data ensures accuracy and delivers genuine insights. Sales tracking completes the picture, linking campaigns to revenue, and underscoring the role of precise data management in driving informed marketing strategies and business growth.
Playbook Template
Pirate Skills Example
Playbook Template
Pirate Bills Example
The Value of Spreadsheets in Tracking
When we ask "How do we track?", the real question is what tools will effectively measure our important metrics. This brings us into the realm of spreadsheets, a starting point for growth measurement and a fallback for tracking more complex metrics. Spreadsheets offer a reliable “source of truth” to rigorously record data points, a practice neglected too often by teams either waiting for perfect systems or disillusioned by failed ones. Embrace the simplicity and power of spreadsheets; they can be transformative if used consistently.
Manual Tracking and Its Importance
Though data entry into spreadsheets can seem mundane, it’s a critical step towards understanding and improving vital metrics. Teams must avoid the pitfall of waiting for so-called perfect solutions and engage with spreadsheets to gain immediate insights. Regularly inputting core metrics, even just the essential six we’ve discussed, can vastly change a team's growth trajectory and should be undertaken at least weekly.
Establishing a Campaign Overview
Creating a campaign overview via spreadsheet is an enlightening exercise. This involves documenting and analyzing metrics derived from various campaigns like Meta Ads spend, impressions, clicks, and ultimately lead conversion. Tracking where leads come from, whether via ad managers or CRM tagging, allows for more accurate and meaningful insights than relying solely on often misleading automated analytics reports.
Lead Tracking and Real-World Verification
The discrepancy between ad manager conversion reporting and the actual leads in one’s CRM can be vast. It’s crucial to verify the figures manually and not be led astray by potentially unreliable statistics from automated platforms. Through tracking leads in a spreadsheet, we determine the cost per lead and the lead conversion rate with greater confidence, drawing from a pool of real-world data.
Sales Tracking and Campaign Effectiveness
Finally, managing sales data within a CRM system and linking this to the campaign data helps us understand how campaigns translate into actual sales numbers. Filtering customers by origin provides insights into campaign effectiveness, giving clarity to where investment should be allocated. While tracking this data can seem overwhelming, spreadsheets make it manageable, offering clear, actionable metrics that are key to informed decision-making.
Playbook Template
Pirate Bills Example
Action Steps
Start tracking your most important campaigns in a spreadsheet
Keep track of your inbound lead metrics at least weekly
Track the key sales metrics also on a weekly basis
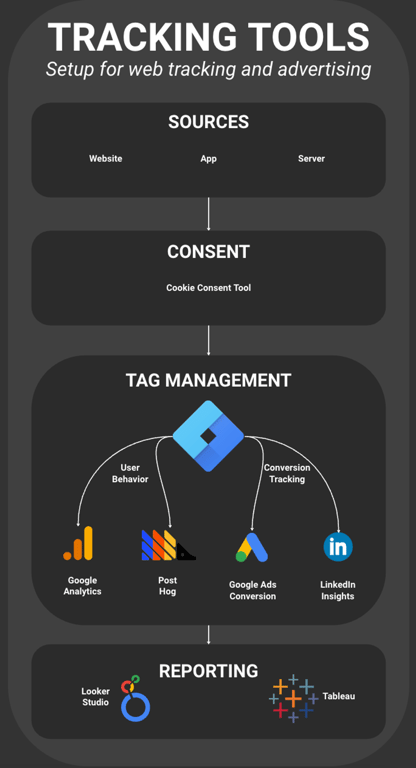
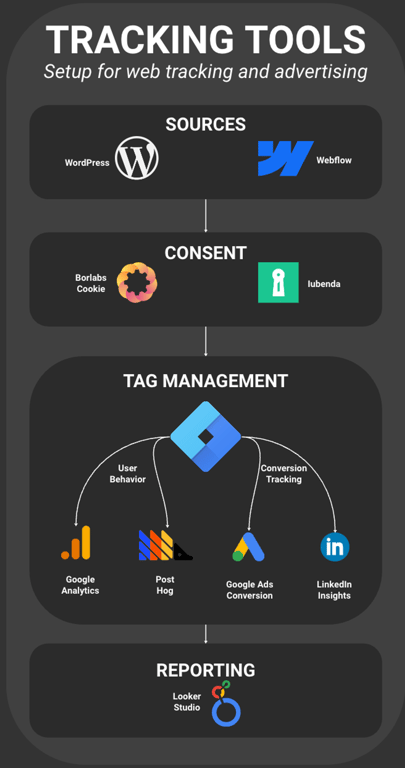
2.2 Tracking Tools - Setup for web tracking and advertising
Let’s get an overview of setting up web tracking and advertising tools. We emphasizes the importance of understanding the framework over the fluctuating details and offers a guide on managing data sources like websites and apps. Additionally, the chapter distinguishes between user behavior tracking and conversion tracking, highlighting the use of Google Analytics or alternatives for the former and specific advertising pixels for the latter. By combining data into actionable reports through tools like Looker Studio, we can derive meaningful insights to inform our marketing strategies. We need a baseline setup comprising a cookie consent tool, a tag manager, behavior tracking solutions, pixels for ad platforms, and report creation for comprehensive analysis.
Playbook Template
Pirate Skills Example
Playbook Template
Pirate Bills Example
The Foundation of Effective Web Tracking and Advertising
In today's digital marketing landscape, the significance of web tracking and advertising tools cannot be overstated. These tools are not just instruments for gathering data; they represent the very foundation of our growth marketing strategies. Their primary function is to enable us to collect, analyze, and interpret user data, turning it into actionable insights. This process begins with a clear understanding of the different data sources available to us - our website, app, server, and CRM. Each source provides a unique perspective on customer interactions, crucial for crafting informed and effective marketing strategies.
The ethical aspect of tracking, especially obtaining user consent, is paramount. It's not merely about legal compliance; it's about respecting the privacy and preferences of our users. Employing tag management systems allows us to honor these preferences while still collecting valuable data. This approach not only aligns with privacy regulations like GDPR but also builds trust with our audience.
The Importance of Data Sources
Identifying and utilizing the right data sources is crucial for effective web tracking and advertising. Our primary sources include the website, app, server, and CRM, each offering unique insights. The website and app, being the most direct points of interaction with customers, are rich sources of behavioral data. However, getting this data involves navigating the complexities of user consent.
Navigating this landscape requires a delicate balance between respecting user privacy and gathering essential data. This is where consent management comes into play. By implementing tools like cookie consent managers and tech managers, we ensure compliance with privacy laws while maintaining the flow of valuable user data. These tools help us manage user permissions effectively, ensuring that we only track what users have consented to, thereby maintaining ethical standards and respecting user choices.
Managing Consent and Utilizing Tag Managers
The role of tag managers in our tracking setup is crucial. They act as a central hub, managing various tracking codes based on user consent. This system simplifies the process of deploying and managing tracking tools, ensuring that we comply with regulations like GDPR.
Tag managers offer a streamlined solution for handling the complexities of web tracking. By centralizing the management of tracking codes, we can deploy different tools based on user consent, reducing the need for constant developer intervention. This approach saves time and ensures that we can quickly adapt to changes in user consent or privacy regulations. The flexibility and control provided by tag managers are invaluable in a landscape where user privacy and data collection are often at odds.
Utilizing User Behavior and Conversion Tracking Tools
Understanding user behavior and effectively tracking conversions are two pillars of web tracking. User behavior tools like Google Analytics and Hotjar give us insights into how users interact with our platforms. This data is vital for understanding user journeys and identifying areas where we can improve the user experience.
Conversion tracking tools, especially for paid advertising, are essential for optimizing ad spend. They help us understand which ads are performing well and why, enabling us to refine our advertising strategies for better ROI. These tools also provide crucial feedback to advertising platforms, allowing them to improve their targeting algorithms. This symbiotic relationship between our tracking efforts and the advertising platforms' targeting capabilities is key to maximizing the effectiveness of our ad campaigns.
Reporting and Analytics
The ultimate goal of collecting data is to turn it into actionable insights. Reporting and analytics tools like Google Data Studio play a critical role in this process. They allow us to visualize data in a way that is easy to understand and act upon. For example, by tracking conversion rates from different ads, we gain insights into which ads are most effective and why.
Effective reporting goes beyond just presenting data; it involves interpreting it to make informed decisions. This means looking at data trends, comparing performance across different channels, and understanding the impact of our marketing efforts. The ability to turn raw data into meaningful insights is what sets apart successful growth marketing strategies.
Moving Forward: Continuous Adaptation and Community Support
The landscape of web tracking and advertising is constantly evolving. New tools, technologies, and regulations emerge regularly, necessitating continuous adaptation. Staying current with these changes is crucial for maintaining effective tracking systems.
Engaging with communities like the Sailors Circle and attending workshops can provide additional insights and support. These platforms offer opportunities to share experiences, learn from peers, and stay updated with best practices
Playbook Template
Pirate Bills Example
Action Steps
List your key data sources for the tracking setup
Find a solution to make consent management easy
Employ a tag manager for code-free pixel management
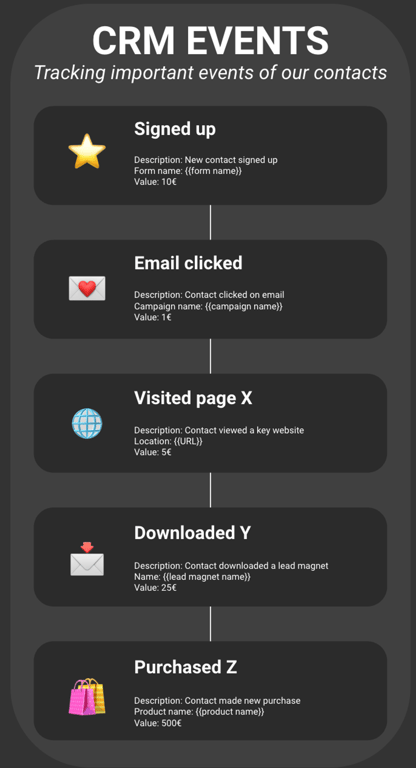
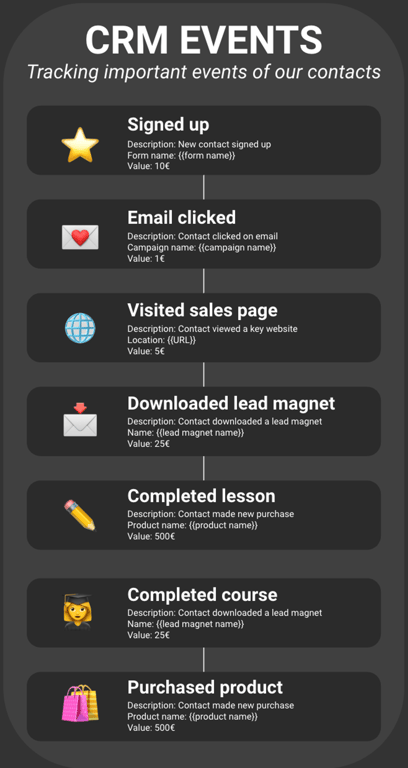
2.3 CRM Events - Tracking important events of our contacts
In this chapter, we delve into the importance of CRM events tracking in growth marketing. Identifying and tracking significant events in our CRM not only illuminates the customer journey but also turns these insights into actionable strategies. It's a critical component in our quest to engage with our audience effectively and drive conversions. By continually monitoring these events, we're not just collecting data – we're building a deeper understanding of our customer's needs and behaviors, ultimately steering our growth marketing journey toward success.
Playbook Template
Pirate Skills Example
Playbook Template
Pirate Bills Example
Playbook Template
Pirate Bills Example
Why CRM Events Matter in Growth Marketing
In the expansive realm of growth marketing, the role of CRM events tracking is a game-changer. It transcends traditional data collection, providing us with rich, actionable insights. Our CRM systems are more than just databases; they're sophisticated tools that capture the essence of our customer's journey. This tracking isn't just a matter of recording data; it's a strategic endeavor to understand and respond to our customer's interactions with our brand. For instance, when a customer signs up, it’s not just an addition to our contact list – it's the beginning of a potential long-term engagement. Assigning values to these events, such as attaching a monetary worth to a new sign-up, enhances our ability to evaluate the effectiveness of our marketing strategies. We delve into the deeper aspects of customer interaction, from how they discovered us to their ongoing engagement, painting a comprehensive picture of our marketing effectiveness.
Identifying Key Customer Journey Events
Our endeavor here is not to track every single customer interaction, but to strategically identify those that truly matter in their journey with us. These key events are like milestones, guiding us to understand our customer's path from initial awareness to eventual conversion. In our CRM, we meticulously record events like signups, email interactions, and page visits. Each of these holds a story – a narrative about our customer's engagement with us. For example, tracking which sales page a customer visited or which lead magnet they downloaded reveals their interests and needs. This approach goes beyond mere data collection; it's about empathetically understanding our customers and fine-tuning our responses to their unique journeys. By capturing these key moments, we're able to tailor our marketing strategies to resonate more deeply with our audience, ultimately driving more effective and personalized customer engagement.
Event Implementation and Value Assignment
The implementation of CRM events is a blend of technical setup and strategic decision-making. Utilizing tools like Google Tag Manager and automations within the CRM, we streamline the process of event tracking. Each event we track is assigned a specific value, turning abstract interactions into quantifiable metrics. This approach allows us to discern the relative importance of different customer actions. For instance, a customer visiting a sales page might be assigned a lower value compared to completing a purchase. These values aren't just arbitrary numbers; they reflect the significance of each action in the context of our customer journey. By assigning values, we gain insights into which interactions are most conducive to conversions, enabling us to allocate our resources more effectively and prioritize strategies that yield the best ROI.
Sales Page Visits and Online Learning Engagement
In our journey to optimize customer engagement, tracking visits to sales pages and online learning activities like course completions is invaluable. These metrics aren't just numbers; they are indicators of customer interest and engagement. When a potential customer visits a sales page, it signifies curiosity or intent, which we aim to convert into tangible action. Similarly, tracking online course engagements gives us insights into the effectiveness of our educational content. It's not only about gauging the popularity of our courses, but also about understanding how these educational tools contribute to the customer's journey. This information is pivotal in refining our content strategy, ensuring that we provide not only what our audience wants to learn, but also what guides them closer to making a purchase. By closely monitoring these interactions, we can tailor our offerings to better meet the needs of our audience, enhancing both their experience and our conversion rates.
Lead Magnets and Their Impact
Lead magnets are a cornerstone of our content strategy, serving as pivotal tools in attracting and engaging potential customers. These aren't just giveaways; they're carefully crafted resources designed to provide value while capturing the interest of our target audience. By tracking the download and usage of these lead magnets, we gain crucial insights into what resonates with our customers. It helps us identify which resources are most effective in attracting leads and what topics or formats garner the most interest. Each download is more than a transaction; it's an expression of trust and interest from the customer. This information is vital in guiding our content development, ensuring that our future offerings are aligned with our audience's preferences and needs. The goal is to create lead magnets that attract and retain customer interest, ultimately leading them further down the sales funnel.
CRM Events: A Source of Truth
In today's digital marketing landscape, where web tracking faces numerous challenges, CRM event tracking stands as a more reliable source of truth. It provides a clearer, more comprehensive view of customer interactions and behaviors. Unlike web analytics, which can be skewed by factors like cookie consent and browser restrictions, CRM tracking offers a more accurate and complete picture. This approach enables us to see not just the quantity of leads but also the quality of their engagement. More importantly, it allows us to track their progression through the sales pipeline, offering insights into the effectiveness of our sales strategies. By focusing on CRM events, we place ourselves in a better position to understand our customers' needs, tailor our marketing efforts to meet those needs, and ultimately drive more effective conversions.
Action Steps
Select and track key CRM events that signify steps in the customer journey
Assign a value to these events for their impact on your goal
Utilize automations in your CRM to capture these events accurately
Action Steps - How we Measure
Step 2 - How we Measure - Ensure that you can track each important metric
Spreadsheets - Best for the beginning and difficult metrics
Start tracking your most important campaigns in a spreadsheet
Keep track of your inbound lead metrics at least weekly
Track the key sales metrics also on a weekly basis
Tracking Tools - Setup for web tracking and advertising
List your key data sources for the tracking setup
Find a solution to make consent management easy
Employ a tag manager for code-free pixel management
CRM Events - Tracking important events of our contacts
Select and track key CRM events that signify steps in the customer journey
Assign a value to these events for their impact on your goal
Utilize automations in your CRM to capture these events accurately
Further Resources
Dig deeper into analytics setups
- Pirate Skills
Step 3 - How we Report - Keep track of these metrics in actionable reports
Playbook Template
Pirate Skills Example
GOAL
Our goal is to adeptly implement a three-step reporting framework - Input, Process, Output - in our growth marketing. We aim to track and analyze key metrics from traffic sources and lead generation (Input), through lead conversion and customer engagement (Process), to profitability and revenue outcomes (Output). This approach will guide us in making data-driven decisions, focusing on actionable insights and avoiding over-complicated analyses. Our focus is on leveraging this framework to enhance our marketing strategies effectively and efficiently.
CONCEPTS & DEFINITIONS
Lead Generation
The process of attracting prospects and converting them into someone interested in your products or services. It involves collecting a potential customer's information through various marketing tactics.
Customer Journey
The complete experience a customer goes through when interacting with a brand, from awareness to consideration, decision, and loyalty.
Conversion Rate
A metric that measures the percentage of visitors who take a desired action, such as making a purchase or signing up for a newsletter.
Profitability Analysis
The process of evaluating the financial benefits a company receives from a particular activity or campaign, compared to the costs incurred.
Data-Driven Decision Making
Using facts, metrics, and data to guide strategic business decisions, rather than intuition or personal experience.
3.1 Input, Process and Output
We need to lay out a clear, structured approach to reporting our marketing efforts. By focusing on the three key stages of Input, Process, and Output, we gain a comprehensive view of our marketing funnel, from traffic generation to lead conversion and finally to profitability. This structured approach enables us to make data-driven decisions, ensuring our marketing strategies are not just creative but also effective in driving growth. The next step is to put these insights into action, refining our tactics and strategies based on real-time data, and continuously driving towards our goal of growth marketing mastery.
Playbook Template
Pirate Skills Example
Playbook Template
Pirate Bills Example
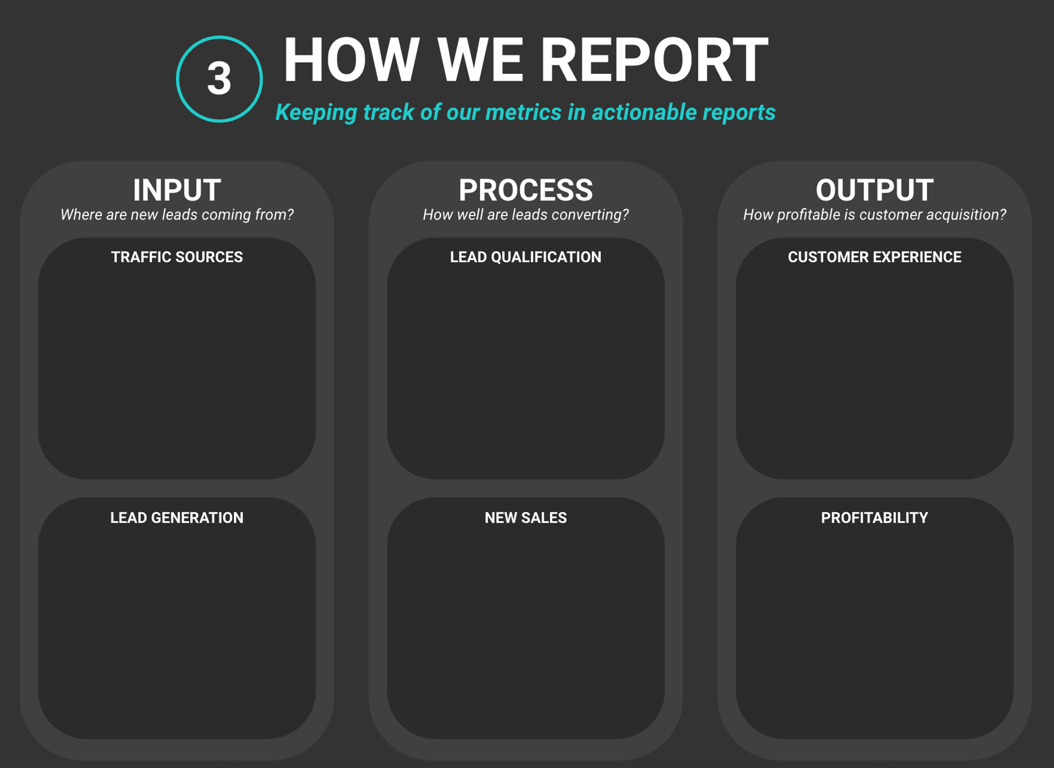
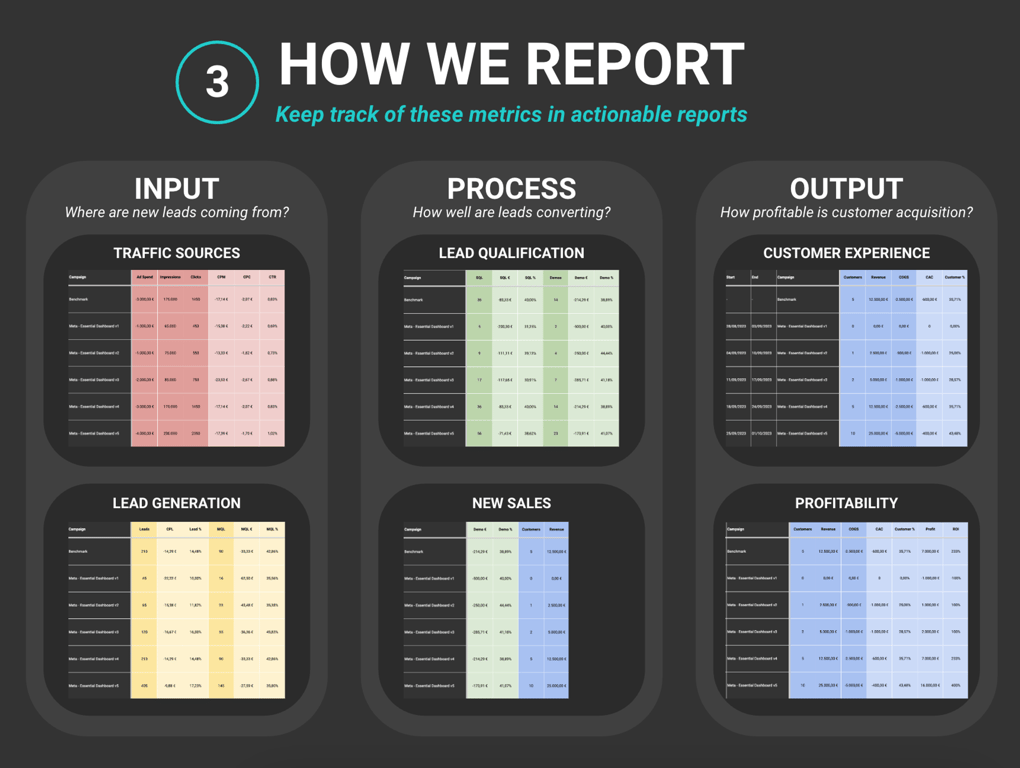
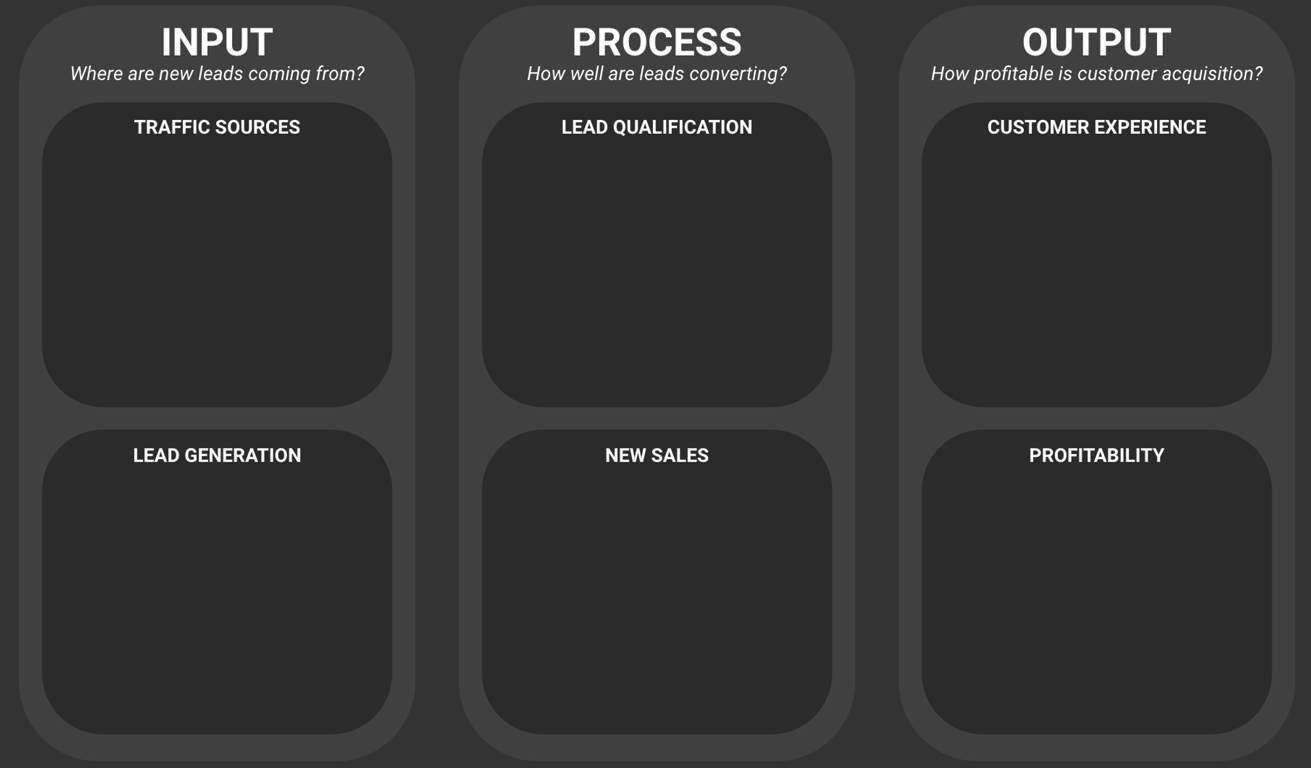
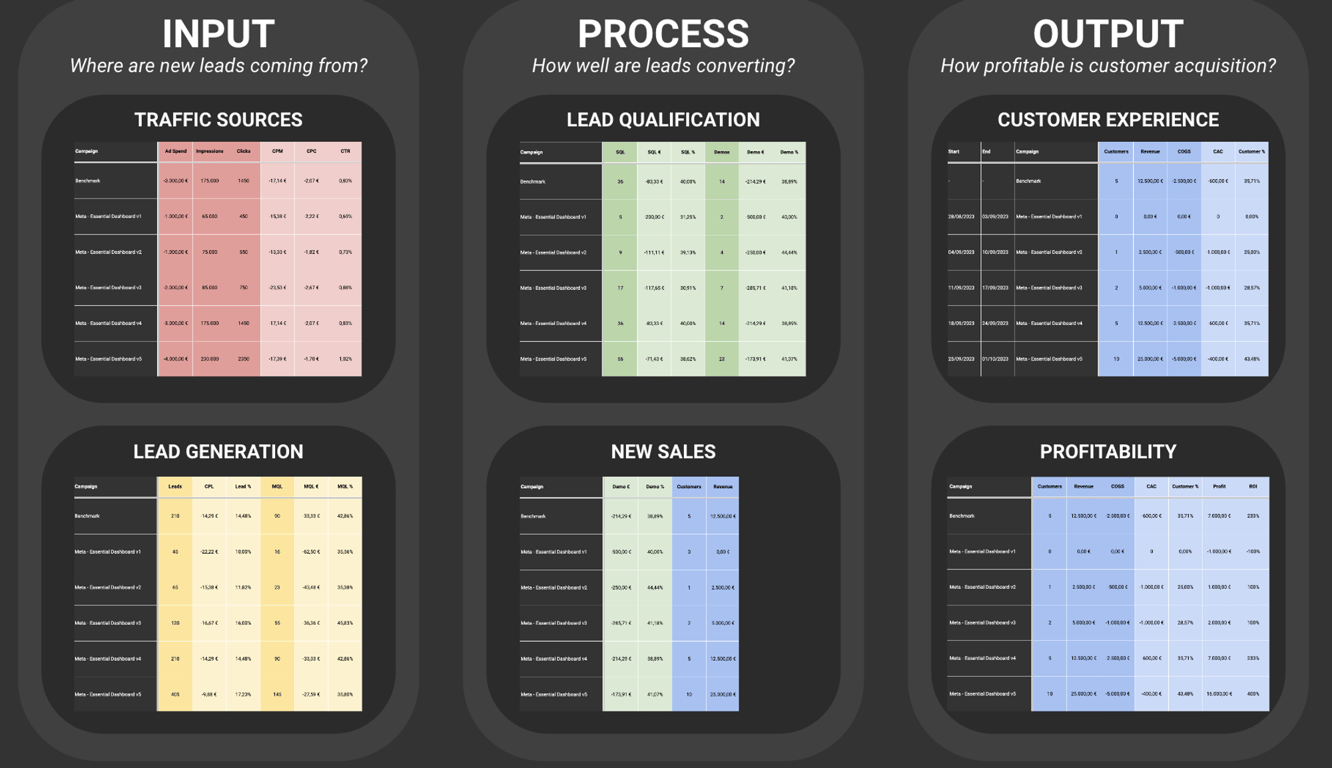
Input, Process, Output: The 3-Area Reporting Framework
In our journey of growth marketing, the ability to accurately track and analyze data is pivotal. Our previous efforts have set the stage for this: identifying key metrics and setting up tools to track them. Now, we focus on reporting—how we keep track of these metrics in a way that's actionable and insightful.
The framework we use is a simple yet powerful three-step process: Input, Process, Output. This means we look at everything coming into our system (Input), what happens in the middle (Process), and the final outcomes (Output). Understanding this flow is crucial for making informed decisions and driving improvements.
Input: Traffic Sources and Lead Generation
Input primarily deals with traffic sources and lead generation. For us, it's essential to have a holistic view of where our traffic comes from—be it paid ads, organic SEO, or other channels. We track metrics like spend, earnings, traffic, cost-per-click, and engagement rates. However, the key lies in creating a comprehensive traffic overview, ideally separated by campaign or, at the very least, by week.
Lead generation is another critical input metric. We need to know how many new leads are entering our CRM and, importantly, the cost associated with these leads. Tracking this weekly gives us a dynamic understanding of our marketing effectiveness.
Process: Converting Leads and Customer Engagement
Once we've captured the leads, the next step is processing them—converting these leads into tangible results. We track metrics like the number of demo calls or qualified leads and the conversion of these into actual customers. This stage is where the effectiveness of our engagement strategies becomes apparent.
We also monitor customer experiences—how many customers started actively using our products, their long-term engagement, and so on. While it's tempting to delve into detailed customer segmentation at this stage, keeping things simple and manageable is more beneficial.
Output: Profitability and Revenue Analysis
Finally, we arrive at Output, where we assess profitability. Here, we consider how many customers we’ve acquired and what's left after covering costs like production and customer acquisition. Understanding our gross margin weekly helps us determine the financial health of our marketing efforts.
Avoid the trap of over-complicating things with detailed forecasts. A simplified, high-level view is more practical and actionable on a weekly basis.
Playbook Template
Pirate Bills Example
Action Steps
Create performance reports the top of the customer journey
Create performance reports the middle of the customer journey
Create performance reports the bottom of the customer journey
Action Steps - How we Report
Step 3 How we Report - Keep track of these metrics in actionable reports
Input, Process and Output
Create performance reports the top of the customer journey
Create performance reports the middle of the customer journey
Create performance reports the bottom of the customer journey
Further Resources
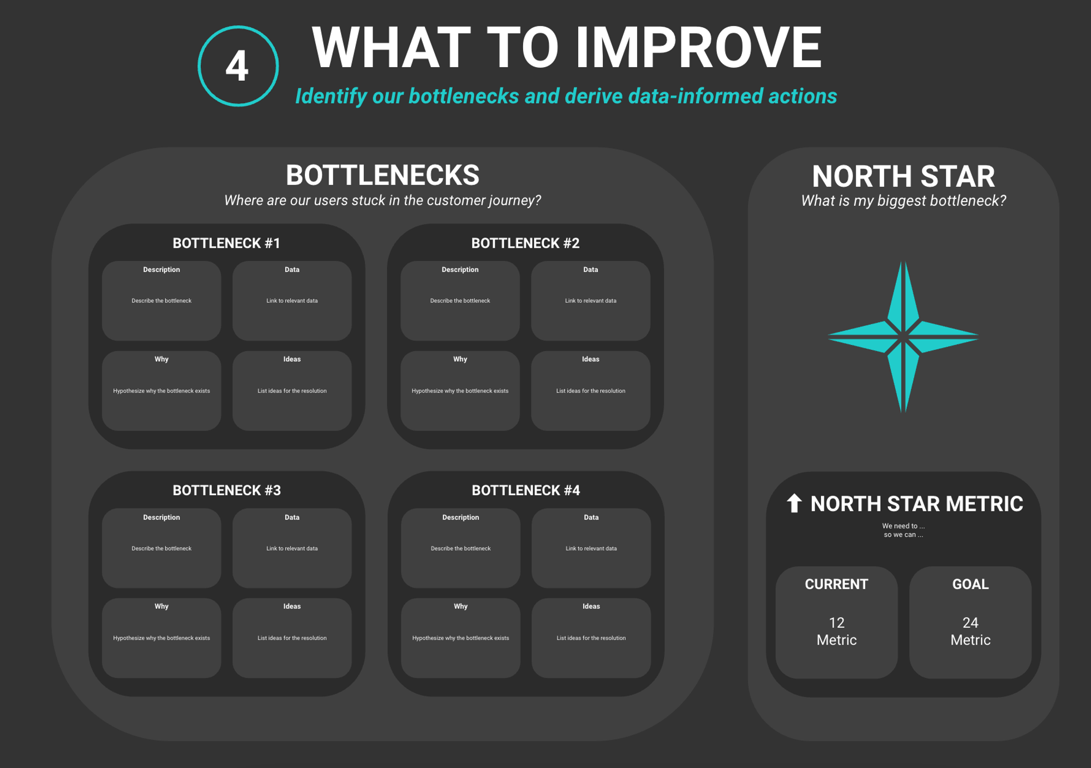
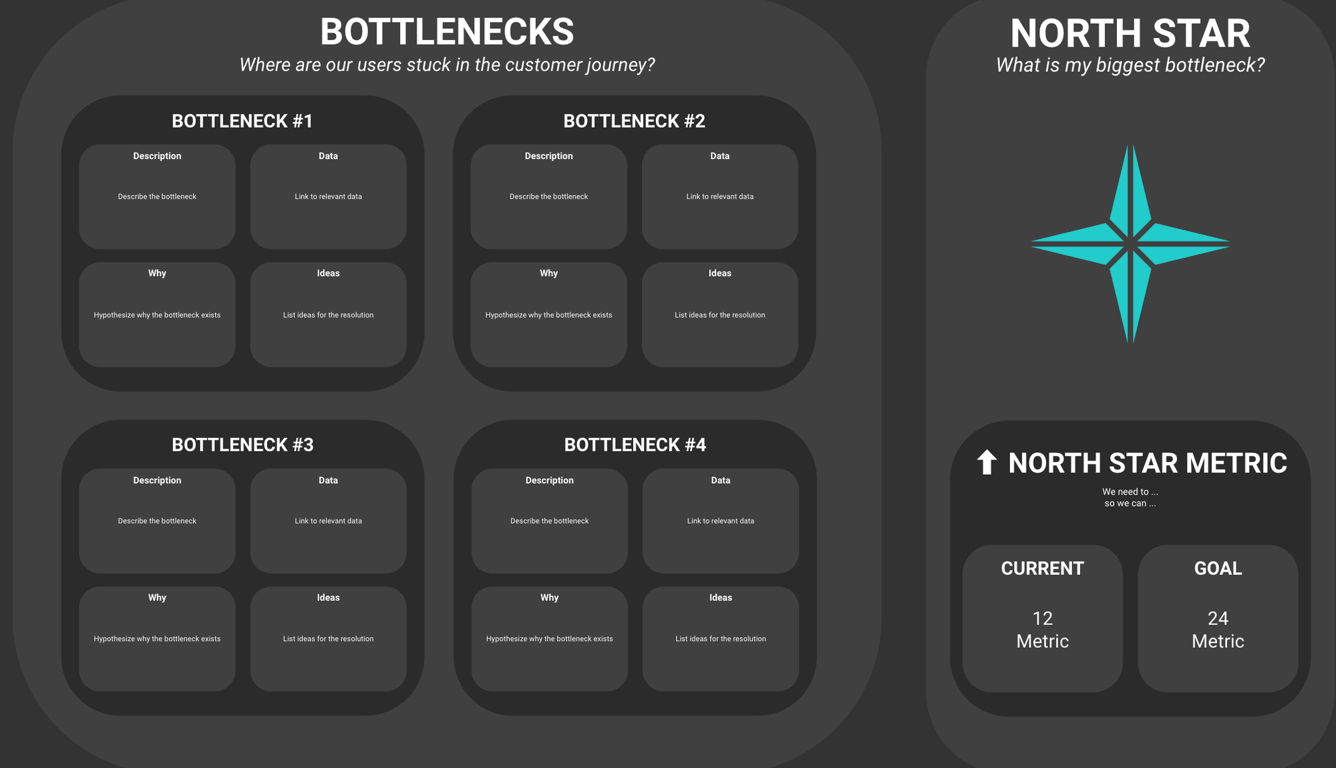
Step 4 - What to Improve - Identify bottlenecks and derive data-informed actions
Playbook Template
Pirate Skills Example
GOAL
We need to empower us to methodically identify and address bottlenecks within our customer journey. By visualizing this journey as a funnel, we aim to pinpoint specific stages where potential customers disengage, thereby impeding our growth. Our focus is to conduct a detailed analysis of these critical points, select an influential North Star Metric that encapsulates our key improvement area, and formulate strategies to streamline the customer path. This approach is intended to enhance customer conversion, retention, and overall marketing efficiency, driving tangible growth for our business.
We need to empower us to methodically identify and address bottlenecks within our customer journey. By visualizing this journey as a funnel, we aim to pinpoint specific stages where potential customers disengage, thereby impeding our growth. Our focus is to conduct a detailed analysis of these critical points, select an influential North Star Metric that encapsulates our key improvement area, and formulate strategies to streamline the customer path. This approach is intended to enhance customer conversion, retention, and overall marketing efficiency, driving tangible growth for our business.
CONCEPTS & DEFINITIONS
Bottleneck
A bottleneck in a customer journey is a stage where the flow of potential customers is significantly impeded, causing a drastic reduction in throughput. It represents a critical point of congestion or friction that hinders the smooth progression of users towards the final goal, such as a purchase or conversion. Identifying and addressing bottlenecks are crucial for improving the efficiency of the marketing funnel and enhancing customer experience and retention.
North Star Metric: The North Star Metric is a single, critical key performance indicator (KPI) that aligns with the company's core strategic goal. It reflects the most influential improvement area within the business and guides decision-making and strategy development. This metric is crucial for focusing efforts across various departments, driving collective progress towards a shared vision of success.
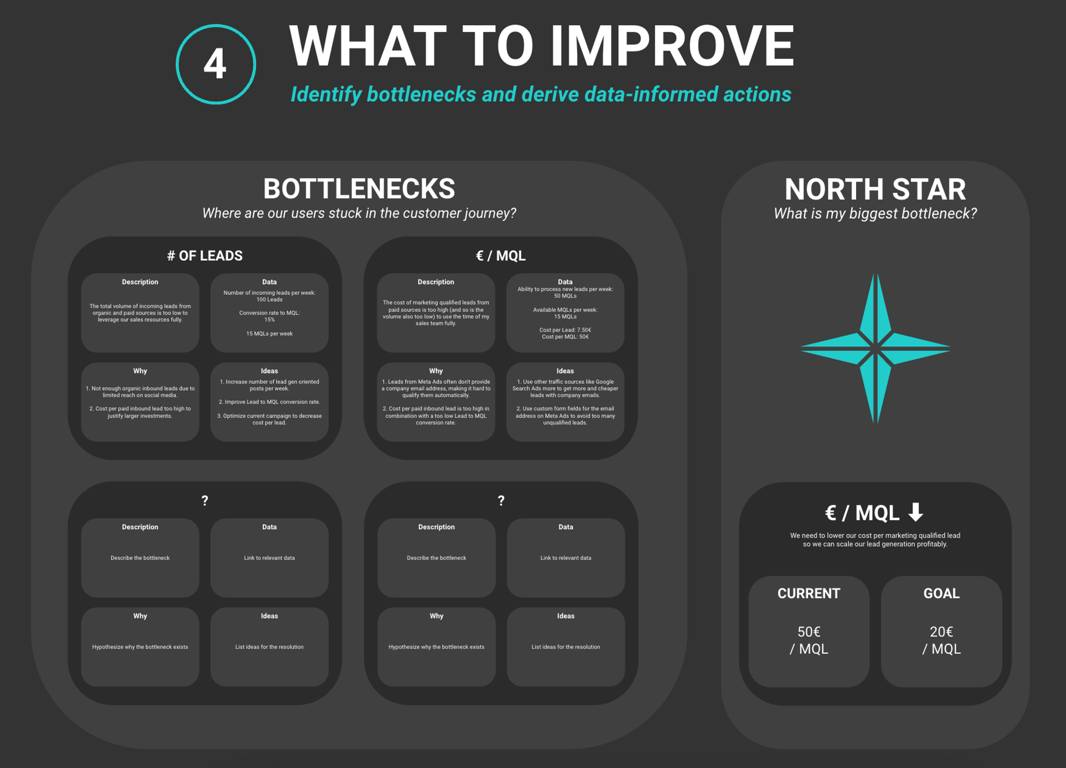
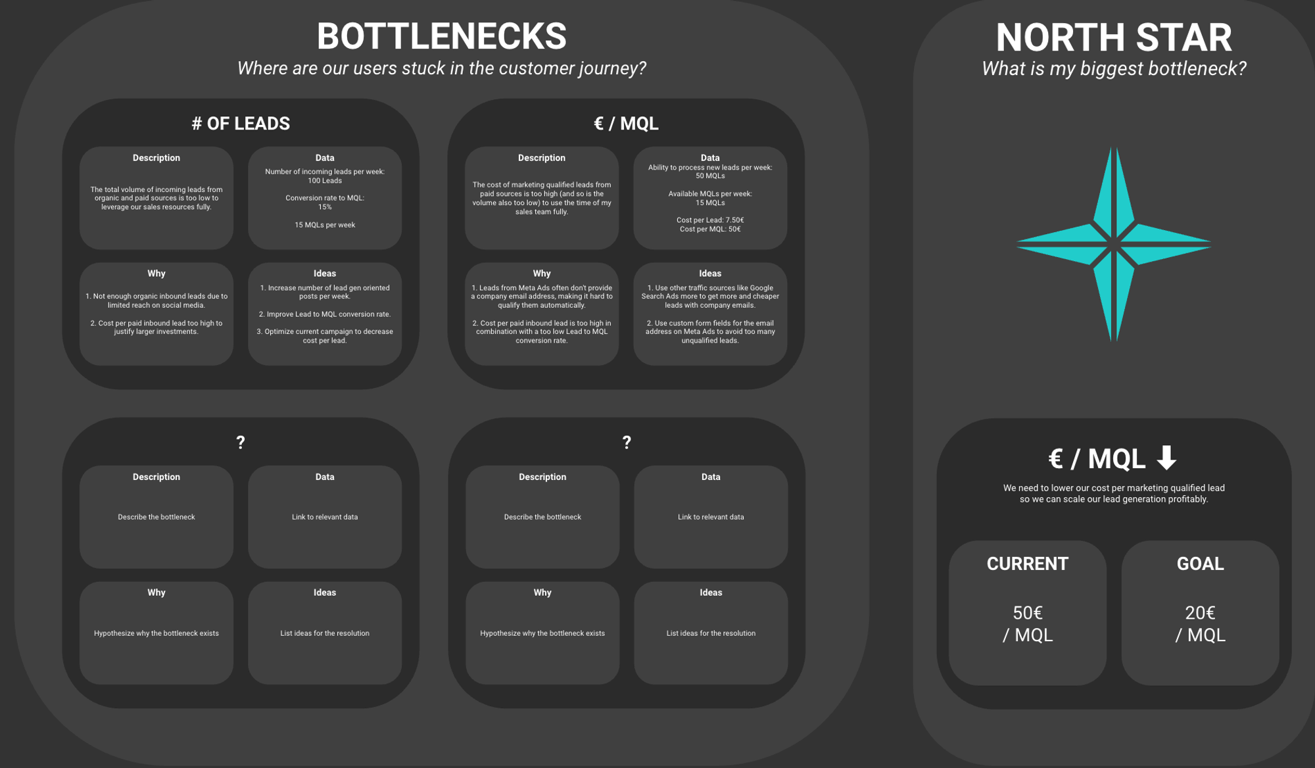
4.1 Bottlenecks & North Star Metric - Where are our users stuck in the customer journey?
Let’s delve into identifying bottlenecks and deriving data-informed actions to improve our marketing outcomes. By adopting a funnel perspective, we aim to maximize throughput, ensuring that potential customers can smoothly progress through their journey. We'are learning about the importance of pinpointing and analyzing bottlenecks, which guide our primary focus for improvement—the North Star Metric. Real-world examples have demonstrated how to conduct practical analysis and uncover solutions for common issues, such as insufficient leads or high cost per lead. Ultimately, our chosen North Star Metric should influence our strategic approach, as it signifies the most impactful area for advancement within our operations.
Playbook Template
Pirate Skills Example
Playbook Template
Pirate Bills Example
Identifying Bottlenecks
To sharpen our marketing approach, we embrace a critical task — pinpointing areas within our customer journey that hinder our growth. This examination is not just a mere observation of data, but a strategic endeavor to locate specific bottlenecks that are limiting our users' experiences and our profit-making potential. We sift through interactions, looking for stages where users disengage or fall off, picturing our process as a funnel with a wide entry point that narrows down. It is essential to uncover these sticking points because they represent opportunities for significant improvements. Rectifying these issues could result in an increase in customer conversion and retention. This initial bottleneck identification serves as a foundation for our growth strategy, setting the stage for more detailed analysis and operational enhancements.
Using The Funnel Analogy
Visualizing our customer's path as a funnel aids in understanding where users are lost along the way. The funnel starts broad, with many potential customers, but as they move through the stages towards purchase, the numbers dwindle. An effective funnel maintains a gradual narrowing; however, serious issues arise when a section becomes constricted, dramatically reducing throughput. This creates a bottleneck—a phase where customers are congested, unable to proceed efficiently. Acknowledging these points where customers are 'stuck' is crucial. It allows us to dissect these parts of the funnel and remodel them, creating a streamlined journey that facilitates users transitioning smoothly from prospect to loyal customer.
Maximizing Throughput and North Star Metric
In the quest to optimize our customer journey, we prioritize bottleneck analysis, aiming to maximize the flow of users through the funnel. As we evaluate our processes, we single out the predominant hindrances. Once mapped, we proceed to analyze these roadblocks—naming, examining, and hypothesizing their existence, as well as strategizing their possible dismantlement. Paramount to this exercise is the concept of the North Star Metric, a singular goal that encapsulates the most influential improvement we can make. It is the metric that, if refined, holds the capacity to transform multiple aspects of the business concurrently, serving as a beacon for our strategic maneuvers.
Practical Bottleneck Analysis
Hands-on analysis begins by clearly delineating each bottleneck. We articulate the issue, tying it to tangible metrics, and ponder on the possible reasons behind it. Let's consider the example of CPL—cost per lead. Suppose we find it too expensive, impeding us from funding our sales operation fully. In this case, the CPL can be a candidate for our North Star Metric. By focusing on lowering this cost, ideally, we would be able to scale up our lead generation processes and invest more astutely, maximizing both the efficiency of our sales team and the profitability of those leads.
Selecting a North Star Metric
The selection of a North Star Metric—our guiding KPI—is a strategic decision made after evaluating all identified bottlenecks. We seek a metric that speaks volumes about our business's most pressing challenge and the means by which its improvement would yield a disproportionate positive impact on our operation. We hone in on this metric and galvanize our focus, engraining it within our strategy for the foreseeable future. By orienting our actions around a single, pivotal goal, we streamline efforts across various departments, pushing collectively towards a shared vision of success.
Conclusion and Action Steps
After isolating our bottlenecks and dissecting their origins, we stand better equipped to select the North Star Metric, around which our subsequent marketing initiatives revolve. This intentional focus allows for concentrated tracking and enhancement efforts, embedding a culture of continuous improvement in our business processes. Working towards scaling this metric fortifies our overall performance and produces compound benefits across the marketing framework. It is essential to maintain flexibility, as the North Star Metric might evolve in response to changing conditions, requiring an agile approach to our growth marketing strategy.
Playbook Template
Pirate Bills Example
Action Steps
Identify the most significant bottlenecks in the customer journey
Define one metric as your North-Star metric
Let the North-Star metrics inform your growth marketing strategy
Action Steps - What to Improve
Step 4 - What to Improve - Identify bottlenecks and derive data-informed actions
Bottlenecks & North Star Metric
Identify the most significant bottlenecks in the customer journey
Define one metric as your North-Star metric
Let the North-Star metrics inform your growth marketing strategy
Further Resources
Dig deeper into actionable metrics
- Pirate Skills
Summary - Eyes on the North Star
From unreliable metrics tools to measurable growth
Embracing Reliable Analytics
As we reach the culmination of our data analytics journey, it's vital to reflect on the strides we've made. We began with a strategy, created content tailored for our audience, and engaged them in the funnel. Now, the focus shifts to tracking their actions and reactions. Our guiding principle throughout this course, "Eyes on the North Star," symbolizes our commitment to not getting sidetracked. We aim to measure progress towards our most important goals, learning swiftly what propels growth and what doesn't.
The Pitfalls of Unreliable Tools
Unreliable tracking tools can leave us navigating in murky waters, unsure of what works and what doesn't. This uncertainty hampers our ability to scale traffic generation or allocate budgets effectively. Without clear visibility on our key metrics, it's akin to gambling our resources. This clarity is also a prerequisite for any conversion optimization effort. Knowing our baseline, like the conversion rate on a landing page, is crucial to understand the impact of any changes we make.
Building Your Analytics Arsenal
Hopefully, you've started to assemble your analytics toolkit, gathering existing reports, and sketching out your current setup. This should lead to a clear understanding of the key steps in your customer journey and associating quantifiable metrics with each. From simple spreadsheets to sophisticated tracking tools and CRM events, the goal is to establish a set of reports for regular review. This ongoing analysis is key to identifying areas for improvement and determining your north star metric.
Standing Out in Data Mastery
By achieving a comprehensive overview of your analytics, you place yourself ahead of the vast majority of projects. It’s a fast track to understanding and leveraging the power of data. For those facing challenges, remember, the Pirate Skills community and workshops are always there for support and guidance. Regular engagement with the community can help in interpreting data and turning insights into actionable strategies.
Continual Learning and Community Engagement
Not everyone can instinctively link data analysis to actionable steps. However, with persistence and community support, this skill can be developed. Engage in the community, share your tracking setups, and learn from others’ experiences. This collaborative approach not only enriches your understanding but also ensures that your data-driven decisions are well-informed and effective.
Now that we've honed our skills in tracking and understanding our data, we're perfectly poised to embark on our next grand voyage: Traffic Generation. With the foundation of reliable analytics, we are set to explore and conquer new territories in marketing. The theme for this exciting next chapter, "Be bold in the Black" signifies our readiness to apply our data insights in real-time. We're not just shooting arrows in the dark anymore; we're equipped with the precision of a skilled archer. Our newfound proficiency in tracking and analytics empowers us to identify, pursue, and amplify campaigns that are not merely engaging but also financially rewarding. As we set our sails towards Traffic Generation, let’s carry forward this spirit of informed boldness, ready to navigate the lucrative waters of high-impact marketing campaigns.
Now that we've honed our skills in tracking and understanding our data, we're perfectly poised to embark on our next grand voyage: Traffic Generation. With the foundation of reliable analytics, we are set to explore and conquer new territories in marketing. The theme for this exciting next chapter, "Be bold in the Black" signifies our readiness to apply our data insights in real-time. We're not just shooting arrows in the dark anymore; we're equipped with the precision of a skilled archer. Our newfound proficiency in tracking and analytics empowers us to identify, pursue, and amplify campaigns that are not merely engaging but also financially rewarding. As we set our sails towards Traffic Generation, let’s carry forward this spirit of informed boldness, ready to navigate the lucrative waters of high-impact marketing campaigns.
See you there!
Ben
Captain at Pirate Skills